I’ve been using Yacy for a month now and I’ve been playing with settings (can’t help it, I have to tinker). I’ve had some success optimizing crawling and search functions but usually not for long. After setting Advanced Crawl option to capture snapshots it caused a memory leak in JVM that maxed out my CPU and memory. Yacy log throwing repeated java.lang.OutOfMemoryError: Java heap space errors. Yacy settings and general info:
Yacy memory set to 12GB
HTTP cache set to 4096
Total system RAM 24GB, 22GB consumed
All 16 cores of CPU running at 100%
java-17-oracle current, Also installed- java-1.11.0-openjdk-amd64, java-1.8.0-openjdk-amd64
Senior peer status before this event but now Yacy can’t connect on Freenet
Indexed 1.5 million, after event I only have 300k (may not be related)
Index data restored from previous install after Yacy Admin navigation & search became too slow
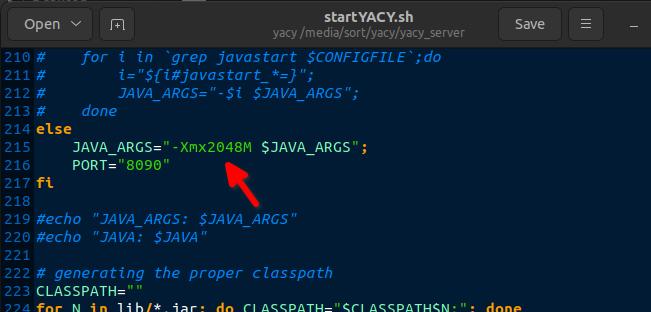
After killing Yacy process and restarting several times I edited startYACY.sh according to https://plumbr.io/outofmemoryerror/java-heap-space and changed -Xmx600M to -Xmx2048M. This allowed me to start Yacy without it immediately consuming all resources. However, the moment I started a crawl it maxed out again, which forced me to hard restart my laptop as everything froze.
Another possible factor is that I had restored a Yacy archive DUMP file from the previous install right after starting new crawls. This may be why my index count dropped, I’m a noob so I’m just stabbing in the dark here. *Note: the index restore was an XML export (3 days ago) and the archive dump was a zip file (earlier today).
If anyone has any advice on how to fix this then I appreciate it. My main reason for posting this is to alert developers of the possible issue with snapshot creation and providing a resource on the topic for other users. I’ll screw around with it a little more but if I can’t get it working normally then I’ll just start over again.
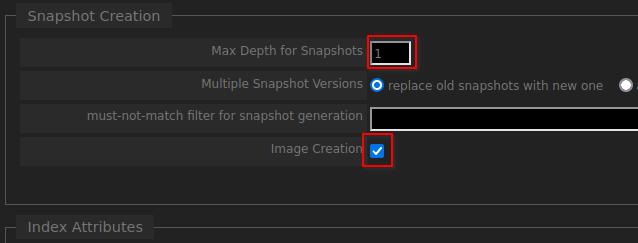
After looking into this more I found the problem was with the post-processing of PDF snapshots. Ubuntu uses Wkhtmltopdf to convert HTML to PDF (heap size appeared to be set to 20GB, even after using crontab to limit it to 6GB). Wkh* was trying to convert to PDF at the same rate as the crawler, so it couldn’t keep up. This overwhelmed the post queue and Wkhtmltopdf isn’t constrained by Yacy’s memory limits. I admit this was mostly my own ignorance about how the XML is converted and how resource extensive it could be with medium/large websites.
Is it possible to add options to the Advanced Crawl selection?
Maybe limiting crawl speeds to allow snapshot creation to keep a reasonable pace? Without limiting other crawls from going full speed.
Or add a section to the single URL crawl page that allows you to snapshot a specific URL already crawled? This would at least keep the active crawls separate from the snapshot creation.
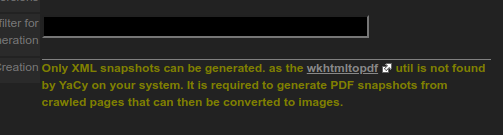
I would guess the last question is feasible since I’m now seeing this warning after uninstalling Wkhtmltopdf.
Once the post-processing queue has hundreds of URLs processing it can’t be stopped, unless I missed a setting to cancel the queue. I did cancel the crawls and turned off snapshots on the Process Scheduling page before rescheduling, but the queue was already at 1,500 URLs.
I decided to just abort that instance of Yacy and reinstalled fresh since I couldn’t even start Yacy without activating the post-processing immediately, which then froze the computer. Yacy is a great engine, so I have no problem with the learning curve. I’ll just keep a backup of past crawls until I can work out the kinks with optimizing.
Would be interested in screen dump of 8090/Performance_p.html
Try this it helps with crawling speed.
Yacy does not get stuck downloading the individual files in the crawler.
Pause crawler and look at.
see 8090/IndexCreateLoaderQueue_p.html
Change Line 331 in yacy/defaults/yacy.init with yacy shutdown.
parser.extensions.deny=iso,apk,dmg,zip,mp4,mp3,pdf,rpm,webm,deb,exe,gz,sql,exe,msi,dll,run
Thats only 2 GB.
Do you change it in 8090/Performance_p.html?
Try turning on process_sxt needed (post-)processing steps on this metadata set
8090/IndexSchema_p.html
Its not enabled by default not sure for what reason its like that.