Hi, what would be the minimum hardware requirements to run a decent size node of the network? What % of the files should it be able to index, etc? Disk, ram, cpu, internet connection. Is there any statistics on this?
Best regards!
Hi, what would be the minimum hardware requirements to run a decent size node of the network? What % of the files should it be able to index, etc? Disk, ram, cpu, internet connection. Is there any statistics on this?
Best regards!
Hardware / Node Details
Observation
Despite plenty of RAM/SSD, search is slow. Likely bottleneck is the older 2012 CPU platform (Gen8 Xeon) rather than memory or disk. YaCy/Lucene query phases lean heavily on CPU latency and single-threaded sections, so newer micro-architecture makes a noticeable difference even at the same clocks.
I only have 50 mbits internet which can be swamped at times when crawling.
Almost any modern server hardware, but a lot of RAM helps a lot, SSD disks too.
After fine tuning crawler I need to update my figures.
https://community.searchlab.eu/t/auto-blacklisting-crawl-delay-offenders/3361
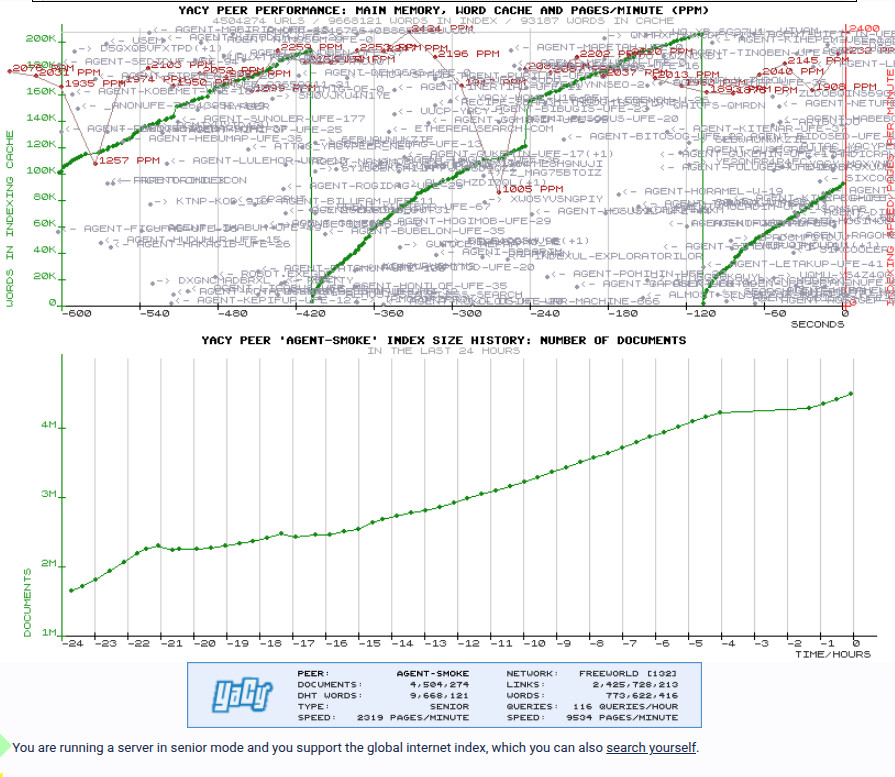
I’m running a solid 2000 ppm anyway im going to run out of space very soon.
Per day: 111 ÷ 2 = 55.5 GB/day
Per week: 55.5 × 7 = 388.5 GB/week (~0.39 TB/week)
Per 30-day month: 55.5 × 30 = 1,665 GB/month (~1.67 TB/month)
Per year: 55.5 × 365 = 20,257.5 GB/year (~20.3 TB/year)
Do you mind explaining what your settings are and what exactly you tweaked to achieve that PPM rate?
I see two other agents on the network that are sustaining ~1000 ppm (Cephei) and 2000+ ppm (agent-kilapen-ufe-26 - is that one you?), and it would be nice if these people would share how they’re achieving those rates.
Thanks.
Sure. The main thing I changed wasn’t CPU, it was I/O discipline.
Disk latency matters more than raw horsepower. Once random I/O is under control, PPM rises naturally.
I’m not using pure mmap for Solr; small in-RAM caching with controlled merges keeps write amplification down.
Crawl-delay is conservative; the gain comes from reducing fan-in (fewer simultaneous hosts / loader threads), not being aggressive per host.
Having a crawl list too long also does not do well.
Network stability mattered too — fixing router/NAT stalls stopped LoaderDispatcher waits.
I also filter early: Quad9 DNS + Pi-hole block a lot of known junk, trackers, and dead domains before they ever hit the crawler.
That’s why the burn rate stays low (~55 GB/day) even when PPM looks high — less churn, fewer pointless writes, more useful pages.
Startup config (Windows – start.smoke.bat)
This is the Java startup block I’m using atm:
:STARTJAVA
set javacmd=%javacmd% ^
 -Djava.awt.headless=true ^
 -Dfile.encoding=UTF-8 ^
 -Djava.io.tmpdir=R:\agent-smoke\tmp ^
 -Dsolr.directoryFactory=solr.NRTCachingDirectoryFactory ^
 -Dsolr.nrtCachingDirectoryFactory.maxMergeSizeMB=1024 ^
 -Dsolr.nrtCachingDirectoryFactory.maxCacheMB=8192 ^
 -Dsun.zip.disableMemoryMapping=true ^
 -Dsun.nio.fs.disableFastCopy=true ^
 -Xms8g ^
 -Xmx64g ^
 -XX:MaxMetaspaceSize=1024m ^
 -XX:+UseG1GC ^
 -XX:MaxGCPauseMillis=200 ^
 -XX:InitiatingHeapOccupancyPercent=30 ^
 -XX:+ParallelRefProcEnabled
This setup prioritises low write amplification and stable merges over raw aggression, which keeps disk burn predictable while sustaining higher PPM.
Auto-blacklisting slow / abusive domains
I’m also using a simple log-driven auto-blacklister that watches crawl-delay offenders and appends them to the crawler blacklist.
The down side is you have to restart yacy and start the crawl again.
It’s based on this thread:
https://community.searchlab.eu/t/auto-blacklisting-crawl-delay-offenders/3361
The idea is to drop domains that repeatedly force long crawl-delays (login portals, infinite catalogs, bot-traps) so they stop consuming loader slots and disk churn. This helps keep PPM high while reducing pointless write amplification.
Combined with DNS filtering (Quad9 + Pi-hole), it removes a lot of junk before it ever reaches Solr.
I’ve put the working setup and related changes here:
https://github.com/smokingwheels/yacy_smoke
I’ve made some changes to yacy purely as an experiment.
Hope that helps..
Thanks for taking the time to write all of that up. ![]()
The Java startup block – where is that set – on the command line before invoking Yacy start, or are those flags somehow passed to Yacy startup?
I’m running Yacy on Linux, so just trying to figure out how / where to pass Java flags like that.
Thanks!
Edit:
I see at the top of startYACY.sh where are small set of default Java args are being set.
#get javastart args
JAVA_ARGS="-server -Djava.awt.headless=true -Dfile.encoding=UTF-8";
I guess that would be the line to modify/append with custom args.
For Linux min settings feel free to increase.
note: need space before each setting.

JAVA_OPTS="
 -Djava.awt.headless=true
 -Dfile.encoding=UTF-8
 -Dsolr.directoryFactory=solr.NRTCachingDirectoryFactory
 -Dsolr.nrtCachingDirectoryFactory.maxMergeSizeMB=16
 -Dsolr.nrtCachingDirectoryFactory.maxCacheMB=512
 -Dsun.zip.disableMemoryMapping=true
 -Dsun.nio.fs.disableFastCopy=true
 -Xms500m
 -Xmx4g ^
 -XX:MaxMetaspaceSize=32m ^
 -XX:+UseG1GC
 -XX:MaxGCPauseMillis=200
 -XX:InitiatingHeapOccupancyPercent=30
 -XX:+ParallelRefProcEnabled
"
JAVA_ARGS="-server $JAVA_OPTS";
I have reviewed my settings again after trying a virtual machine out.
Typical provider.
| vCPU | Typical stable crawl (ppm) |
|---|---|
| 2 | 800 – 1,500 |
| 4 | 2,000 – 3,500 |
| 8 | 4,000 – 7,000 |
| 16 | 8,000 – 12,000 |
| 32 | 16,000 – 24,000 |
| 48 | 24,000 – 36,000 |
| 64 | 32,000 – 48,000 |
| 96 | 48,000 – 72,000 |
| 128 | 64,000 – 96,000 |
Above ~25k ppm, CPU is no longer the primary bottleneck.
You must have:
NVMe (local, not network)
≥ 1–2 GB/s sustained write
Low fsync latency
128–256 GB RAM
Large OS page cache
Heap alone is not enough
Very fast DNS (local resolver or Unbound)
Aggressive connection reuse
Crawl-delay enforcement tuned
Solr write queues balanced
HostBalancer not stalling
Domain fan-out wide (no single-host floods)
First, convert rate:
40,000 pages/min
× 60 = 2,400,000 pages/hour
Now disk “burn” has two parts:
Inbound bytes fetched (network, not disk unless cached/logged)
Index + metadata writes (the real disk eater)
Because page sizes vary wildly, here’s a scenario table you can actually use.
Ingress/hr = pages/hr × avg_bytes_per_page
| Avg page size | Ingress per hour at 2.4M pages/hr |
|---|---|
| 25 KB | 60 GB/hr |
| 50 KB | 120 GB/hr |
| 100 KB | 240 GB/hr |
| 250 KB | 600 GB/hr |
| 1 MB | 2.4 TB/hr |
Most “HTML-only” crawling often lands around 25–150 KB average depending on what you’re fetching and how much you allow.
This is the one you asked for (“disk burn”) and the honest answer is:
It depends on how much you index/store per document, duplicates, and how fat your index schema is.
A reasonable practical range for index write amplification is often 5–50 KB per page (sometimes more), depending on stored fields, term vectors, backlinks, and how much of the extracted text you keep.
| Index write per page | Disk writes/hr @ 2.4M pages/hr |
|---|---|
| 5 KB | 12 GB/hr |
| 10 KB | 24 GB/hr |
| 20 KB | 48 GB/hr |
| 50 KB | 120 GB/hr |
| 100 KB | 240 GB/hr |
For this, are you using virtiofs or are you passing the NVME through via PCIe passthrough?
I’m currently using virtiofs (haven’t benchmarked it, but it’s notoriously slow based on online feedback) and I’m now suspecting that passing through an NVMe via PCIe passthrough would be the better approach?
What are your settings for this one?
Thanks.
I’m not sure all I know is its NVME from the deploy with shared CPU.
Good question.
For sustained write-heavy workloads (Lucene/Solr-style indexing, high fsync frequency), virtiofs is not suitable. It’s optimized for file sharing semantics and convenience, not for low-latency, high-throughput write paths. In practice it introduces extra context switches and FUSE overhead, and fsync latency is significantly worse than raw block access.
If you need 1–2 GB/s sustained writes with low fsync latency, the correct options are:
PCIe NVMe passthrough (best performance, near bare metal), or
virtio-blk / virtio-scsi backed by a raw NVMe device (acceptable, but still slower than passthrough).
PCIe passthrough gives the guest direct control of the NVMe queue pairs and avoids the host filesystem layer entirely, which is exactly what indexing workloads benefit from.
virtiofs is fine for config files or shared trees, but for the index/data path it will be the bottleneck long before CPU or memory.
Currently using 8 G.
From ctrl panel.
Perfect. Thanks for the clarification.
I will have to do some data shuffling and re-working of my setup in order to get an NVME dedicated (via PCIe passthrough) to my Yacy VM.
Yacy is currently writing to a ZFS mirrored pool (consisting of pair of 4TB Samsung 990 PROs) that’s passed through to the VM via virtiofs – obviously sub-optimal.
Try increasing
What are your settings?
I’m using 1024 and 8192
I can get a peak of 4k ppm off a USB 3 SSD with 13 year old Zeon with NBN 50.
Your subsystem maybe ok just need tuning.
That’s what I have set as well, based on your recommendations further up.
I also need to address my DNS situation. Yacy is currently running through a VPN connection (for static IP) and it’s using the VPN provider’s DNS.
I need configure it via the wireguard connection config to instead use my local (LAN) DNS / block list.
try 2048 and 16384 if you have that much memory to spare?
Also I’ve added a DNS Throttle to my copy of yacy, this is just for testing.
I found with big lists yacy was giving 30k Hits on my pihole and making it go slow.
It may take 5 mins to ramp up a crawl on a big list.